


On average, a thousand goals are scored in a Premier League season. Most of them are average, but there are some crackers. We don’t know how you feel about it, but we love watching season highlights, especially when it gets to the goals part. Usually the most of them are long shots or cheeky finishes, maybe some unstoppable solo goals, but as we can remember, they used to be long shots mainly. Have you ever noticed that there are fewer long-range shooting attempts in matches? Is it a slow xG revolution in the Premier League? Well, let’s see what the data tells us!
Let’s start with the first statement. So there are around 1000 goals in a single Premier League season, and the most of them are scored by right-foot shots. We can see almost the same thing in the last eight seasons; nothing surprising happens in terms of goal type distribution, and it is also not the most exciting thing about the topic. It was just the warm-up session.
If we go deeper into the stats of shots, we find some interesting things. So we have all the data from the last eight PL seasons and started thinking about how we should check our guess about the long-distance buzzers, so our further investigations are focusing only on open-play shots and goals. First, we established that there are 8200–8500 shots per season on average. The scoring rate from these ones is not significantly high or low for any of the seasons, but… Is it a slightly increasing tendency in average xG?
It seems like that. Which factors can drive that increase?
About the Expected Goals (xG)
As you may know, xG is a metric that’s intended to measure the probability of a shot resulting in a goal. Actually a rating of how good of a goal-scoring opportunity it is. A penalty worth 0.75 xG.
Returning to the question of drivers, we can link the slight xG increase with the numbers of penalty goal growth, which seems to be true, as we can see on Chart 1.
OK, turn the page. The next aspect to check is distance. The logic is simple: the closer the shot is taken, the more xG is expected.
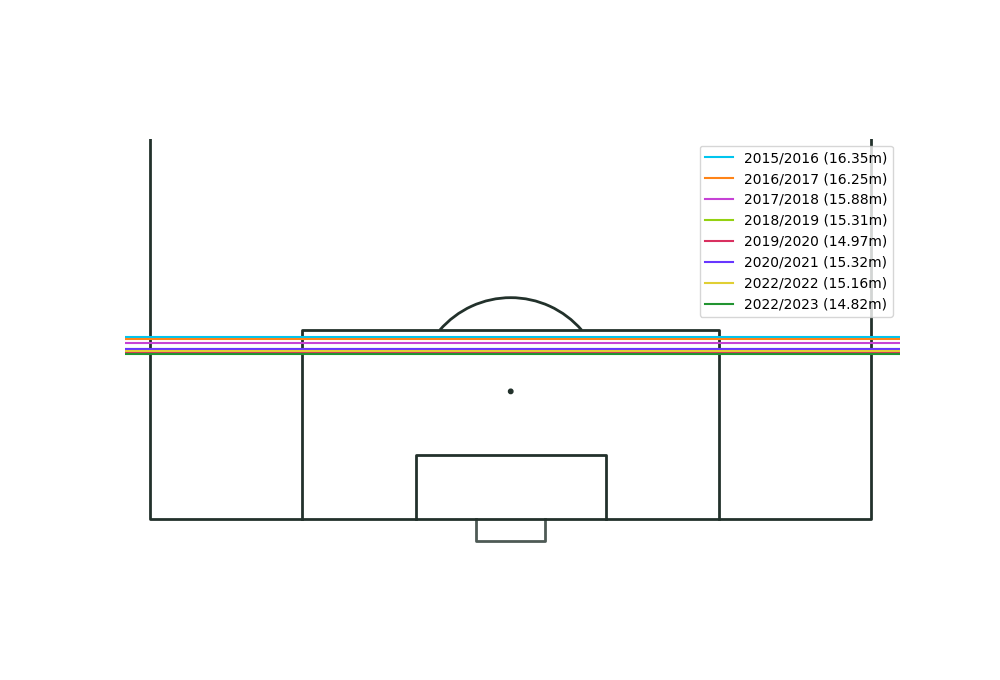
One step closer. As we can see, the average distance of shots shows a decreasing tendency over the seasons. There could be several reasons behind it. Defensive lines are higher after VAR’s introduction; more crosses are delivered to the box, etc. Probably a combination of these, but it is too significant to ignore the fact that there is a change in football nowadays.
The tendency can also be observed on this chart. The goal-scoring position is slowly dropping. By the way, this chart perfectly
illustrates the strong connection between distance and xG as well. If we are talking about distances…
We have reached the point where we can take a look at our starting point: the long shots. More precisely, the shots out of the box.
Obvious trends are right in front of our eyes. As we mentioned before, there are 8200–8500 shots per season on average, and the outside shots are definitely falling from season to season. If we interpret this chart together with the decreasing average distance of goals, they easily make us understand the increasing of xG in the Premier League. Based on the last eight seasons’ data, we can state that the shots come from closer and, in connection with it, the goals are scored from a closer position than before, which causes an xG growing trend. Of course, that trend must be broken in the future, but it is still open when it’s going to reach the peak.
(Cover photo: Phillip Kofler - www.pixabay.com)
