


In the second part of our data analysis article, we show how the state of too much information revolutionizes the Premier League, and who were the most decisive users of the data, who got a real advantage on the football pitch.
1992 was a landmark in football. This year Premier League was founded, the European Cup was rebranded as the Champions League and the back-pass law was introduced, which had been forced into action by the disastrously negative 1990 World Cup, and the increasing popularity of time wasting. Many people say that “football wasn’t invented in 1992”, but the modern era of the sport was born this year. A new, exciting, and much more amusing period began then, which led to a faster and more technical football identity. From 1996 we have been able to justify it by numbers. The big break for stats came in 1996, when Opta Consulting – or many knows nowadays, STATS Perform – began to collect match data for the Premier League. The main aim of the management of the company was to build its own brand by creating soccer rankings. The Premier League’s sponsor, Carling, paid for the Opta Index, while clubs and media got the data for free. Each club received an Excel report with some basic statistics. By today’s standards, these statistics were primitive, but back at the time, it was revolutionary. Within just a few years, the game moved from a paucity of data to a state of too much information. Pretty soon Opta and its rivals were sending out thousands of new data points each week. Clubs learned facts they had never contemplated before: how many kilometers each player ran per match, and how many tackles and passes he made.
Collecting these numbers happens manually even nowadays, although, some companies experiment with automatic tagging by artificial intelligent. Simon Kuper, one of the writers of Soccernomics, visited Opta’s tenth-floor offices next to London’s Waterloo station in 2011, the day after Manchester City won 1–6 at Old Trafford in October 2011. Two young men were sitting side by side, each in front of a computer, both watching the same game on a screen. One logged all of City’s actions, and the other all of Manchester United’s. Two other people had logged the game live the day before, but Opta likes to repeat the process the next day “with a different set of eyes”. “We’re collecting 2,000 events a game live as it happens, with every event logged with a time code and a pitch coordinate, so you have to keep up with it” – said John Coulson, former head of professional soccer services at the company. This kind of job is popular among young people, who can’t resist the temptation of earning money to watch football matches. Nevertheless, the fluctuation is very high, because most of the people burn out after a couple of years due to monotony.
FIFA bringing performance analytics to a whole new level
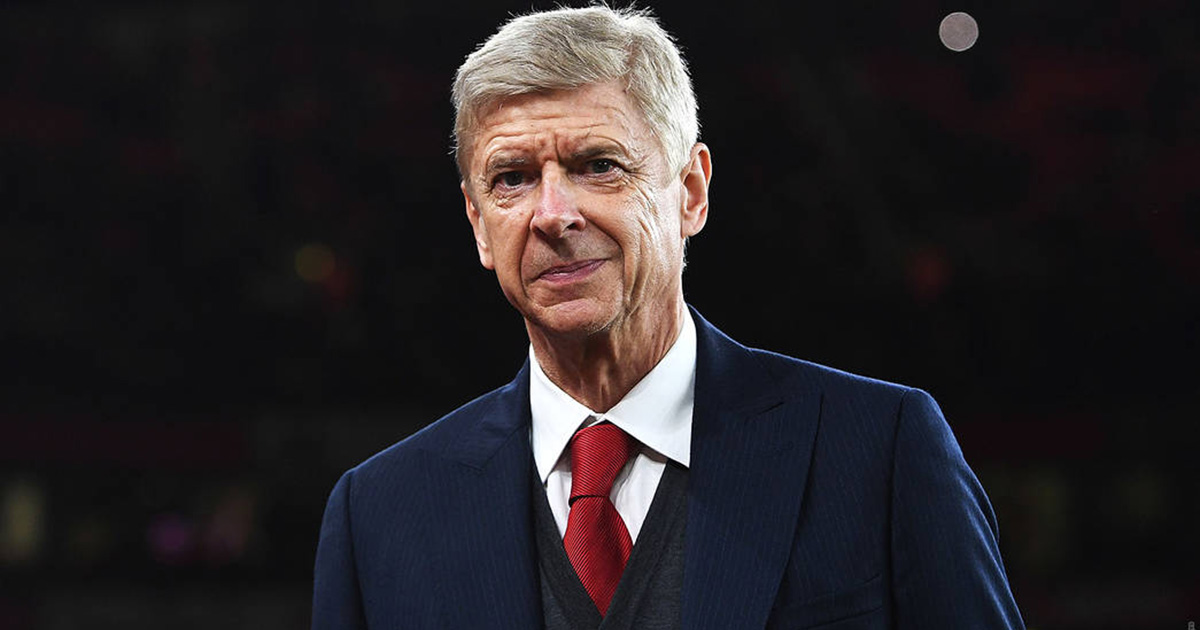
A team of experts were analysing every player for every second of every game of the FIFA Arab Cup 2021. For each match of the FIFA Arab Cup 2021, one member of a team of analysts, based in Newport, Wales, was assigned to one player on the field to monitor, track and code their individual performance. This includes noting a player’s movement, with and without the ball, how many times they break through lines of defence, and how much pressure they put on opposition ball carriers. This intensive analysis means that instead of usual 2,000-2,500 data points, over 15,000 data points were collected from every game, giving team analysts, coaches, players, media, and supporters new insights to help them better understand and enjoy the game. The main supporter of this project is Arsène Wenger, FIFA’s Chief of Global Football Development. “The FIFA Football Language is the alphabet of data collection, and it helps us to make conclusions [about] what’s happening on the football pitch and to better understand what’s happening on the football pitch,” said one of the most influential managers of Premier League’s history. FIFA is planning to use similar analytical approach for FIFA World Cup 2022.
Gradually managers started to look at the stats being pumped out by the data companies. In 2001 Alex Ferguson suddenly sold his defender Jaap Stam to Lazio. The move surprised everyone. Some thought Ferguson was punishing the Dutchman for a silly autobiography he had just published. In truth, although Ferguson didn’t say this publicly, the sale was prompted partly by match data. Studying the numbers, Ferguson had spotted that Stam was tackling less often than before. He presumed the defender, then twenty-nine, was declining. So, he sold him. It was a milestone in soccer’s history: the first major transfer driven largely by stats. As it later turned out – and Ferguson admitted – it was a mistake. The Scot had studied the wrong numbers, because as Nate Silver points out in his book The Signal and the Noise, more data becomes available, we become more likely to use them to make mistaken decisions. Often, the masses of data seem to form a pattern that just isn’t there.
Despite the dangers, Arsène Wenger had a strong faith in match data, in fact, the French manager was way ahead of his time. He said the morning after the game he was like a junkie who needs his fix: he reaches for the spreadsheets. Wenger’s obsession to the numbers was confirmed by Dennis Bergkamp, one of the best Dutch football players at the time. In his autobiography he remembers a story when he gets into a fight with his manager. “Where in your statistics does it say that I changed the game with a killer pass?” recalled Bergkamp. “You are right,” answered Wenger, “but you run less in the last thirty minutes and you’re more at risk of getting injured, and your pace is dropping.”
Wenger brought knowledge to the Premier League, that no one had back then. Besides using match data, Wenger reformed the dining habits of the players, banning candies, chocolates, and Coca-Cola, and he made the players eat more fish, chicken, and vegetables. He also asked them to take food supplements, which strengthened the players so much that they had to explain themselves to their teammates at the national teams, why they were looking so sharp. In a short time, however, his own knowledge became Wenger’s biggest enemy. Other managers started to study what Wenger does exactly: they embraced his innovations regarding with dining, scouting, and using statistics. Moreover, the ageing Wenger became more and more stubborn, and he wasn’t willing to study new concepts. Eventually, when everyone was on the same level, the wealthy clubs got the better of Arsenal. This is what happens to the not existing knowledge in a league: it disappears. This is the explanation why Wenger’s Arsenal didn’t win a single trophy between 2005 and 2013.
It is a little bit of surprise, but in the early 2000s the other innovator of the Premier League was Sam Allardyce. Wenger is known for introducing scientific ideas to the English football, while Allardyce brought actual football specific innovations to it. As a player, he spent a year at Tampa Bay, where he was impressed by the professionalism of the American sports and the fact that they put the scient and the statistics at the service of the sport. Allardyce was appointed as Bolton manager in 1999, and given he had no money for good players, he surrounded himself with good experts. Numbers played a major part of Allardyce’s work: in the pre-season he told the players his expectations regarding the goals scored and the goals conceded, and as one of the first users of ProZone software, he analyzed the players and the matches in detail. At half-times he continuously rewound the tape of the first half to justify his instructions. With his limited opportunities, Allardyce put emphasis on the “cheap goals”: corners, free-kicks, throw-ins. Gavin Fleig, one of Allardyce’s pupils, in Soccernomics recalls that in Allardyce’s time the 40-50 percent of Bolton’s goals came from direct plays, while the league average was around 30 percent.
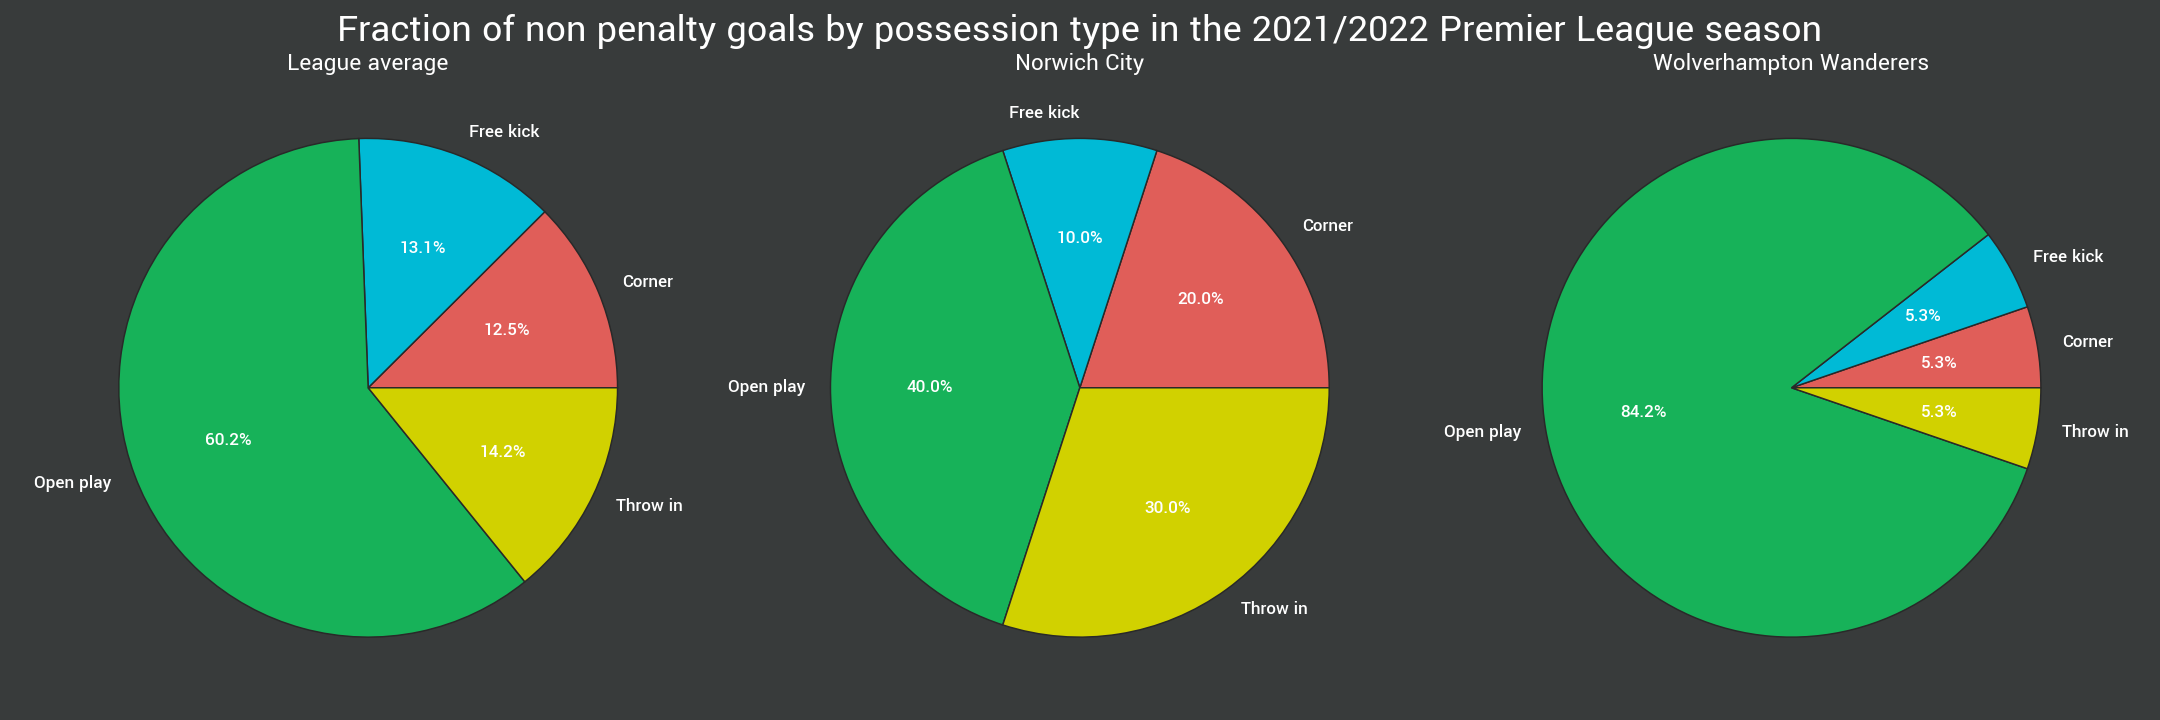
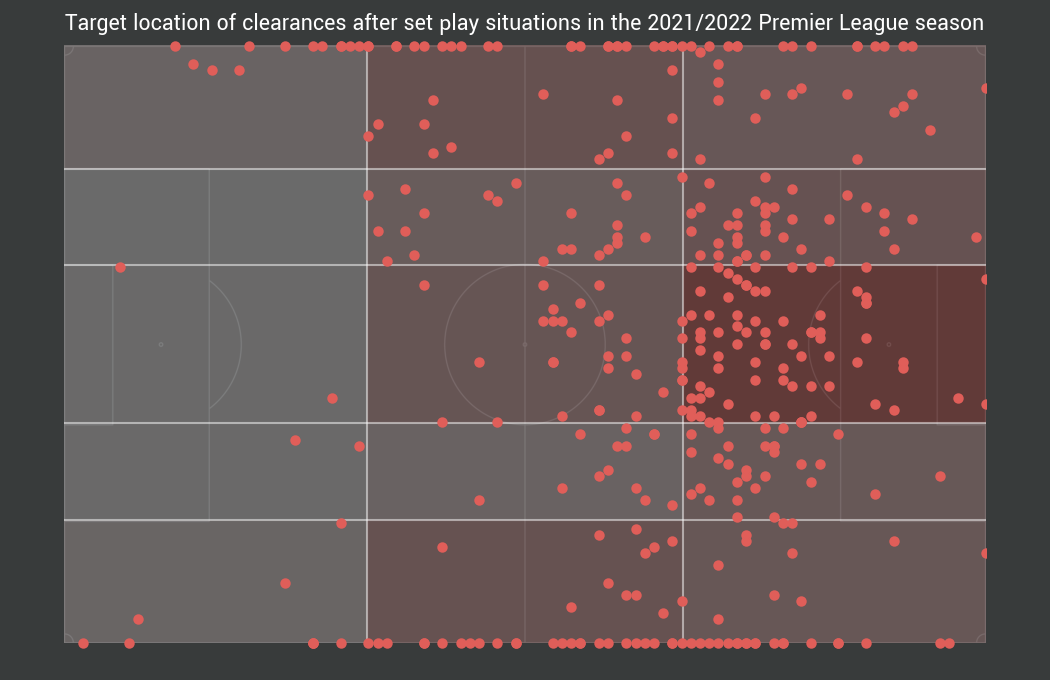
“We took a look at where the clearances go after the corners and throw-ins, and then we concentrated our forces to those zones. If we couldn’t get the ball firsthand, we still had the chances to get the second balls,” said Fleig. One of the greatest achievements of Allardyce’s obsession to the numbers was the “commander” room at Bolton’s training center, where Allardyce and his stuff could study the endurance, passes, distance covered, number of sprints, tackles, recoveries, and those kind of statistics on the screen. This was a decisive point in terms of tactical and endurance development, because Allardyce could rest his players before they would have gotten hurt. Other teams also used similar methods, but Allardyce was convinced that his team was the most modern club in Europe.
Allardyce’s faith in direct plays was grounded: these are the most predictable events of the matches. Penalties are included, and no one knows this better than the British. Back in the 1970s, a Dutch manager named Jan Reker began to build up an archive of index cards on thousands of players. One thing he noted was where the player hit his penalties —or at least the penalties that Reker happened to know about. The Dutch keeper Hans van Breukelen would often call Reker before an international match for a briefing. Nobody paid much attention to this relationship until 1988. That May, Van Breukelen’s PSV reached the European Cup final against Benfica. Before the match in Stuttgart, the keeper phoned Reker. Inevitably the game went to a penalty shoot-out. At first Reker’s index cards didn’t seem to be helping much—Benfica’s first five penalties all went in—but Van Breukelen saved the sixth kick from Veloso, and PSV was the European champion. A month later, so was Holland. They were leading the USSR 2–0 in the final in Munich when a silly charge by Van Breukelen conceded a penalty. But using Reker’s database, he saved Igor Belanov’s weak kick. Sum up, we can say that Reker’s work largely contributed to a European Cup and a European Championship.
Nowadays, this is the entry level. In Berlin in 2006, the World Cup quarterfinal between Germany and Argentina also went to penalties. Jens Lehmann, the German keeper, emerged with a crib sheet tucked into his sock. This sheet contained some potential Argentine penalty-takers, after the Germans had analyzed approximately 13,000 kicks. Of the seven Argentines on the list, only Ayala and Maxi Rodríguez actually took penalties. However, Ayala stuck exactly to Lehmann’s plan: he took a long run-up, the keeper waited a long time, and when Ayala dutifully shot to Lehmann’s right, the keeper saved. Rodríguez also did his best to oblige. He put the ball in Lehmann’s left-hand corner as predicted, but hit it so well that the keeper couldn’t reach. However, Van Breukelen’s and Lehmann’s stories are less memorable than the Champions League final in Moscow in 2008. In 1995 the Basque economist Ignacio Palacios-Huerta, who was then a graduate student at the University of Chicago, began recording the way penalties were taken. His paper, “Professionals Play Minimax,” was published in 2003. One of Huerta’s friends knew Avram Grant, Chelsea’s manager back at the time, and when Chelsea reached the final in Moscow in 2008, he put the two men in touch. Huerta then sent Grant a report that made four points about Manchester United and penalties.
Huerta’s four-points list
- Van der Sar tended to dive to the kicker’s “natural side” more often than most keepers did.
- Ignacio emphasized in his report that “the vast majority of the penalties that Van der Sar stops are those kicked to a mid-height (say, between 1 and 1.5 meters).
- Ignacio wrote in the report, “Ronaldo often stops in the run up to the ball. If he stops, he is likely (85%) to kick to the right-hand side of the goalkeeper.” Ignacio added that Ronaldo seemed able to change his mind about where to put the ball at the very last instant. That meant it was crucial for the opposing keeper not to move early. When a keeper moved early, Ronaldo always scored.
- The team that wins the toss before the shoot-out gets to choose whether to go first. But this is a no-brainer: it should always go first. Teams going first win 60 percent of the time.
It is hard to tell how big Huerta’s influence was, but he was right. Chelsea’s first six penalty-takers all hit the ball to Van der Sar’s left, only Ashley Cole partly disregarded Huerta’s advice. Cole was left-footed, so when he hit the ball to Van der Sar’s left, he was shooting to his own “natural side”—the side that Huerta had said Van der Sar tended to choose. Van der Sar didn’t save a single penalty. Five of Chelsea’s six kicks had gone in, while Terry’s, as the whole world knows, flew out off the post with Van der Sar in the wrong corner. It was Anelka’s turn to kick. But after six kicks, Van der Sar, or someone else at Manchester United, had figured out that Chelsea was pursuing a strategy. As Anelka prepared to take Chelsea’s seventh penalty, the gangling keeper, standing on the goal line, extended his arms to either side of him. Then, in what must have been a chilling moment for Anelka, the Dutch- man pointed with his left hand to the left corner. “That’s where you’re all putting it, isn’t it?” he seemed to be saying. He decided to avoid the left corner, where he had presumably planned to put the ball. Instead, he kicked to Van der Sar’s right. That might have been fine, except that he hit the ball at mid-height—exactly the level that Ignacio had warned against. Perhaps Anelka was at sea because Van der Sar had pressured him to change his plans at the last moment. Anyway, his decision to ignore Ignacio’s advice probably cost Chelsea the Champions League.
As these examples show, in the 2000s and 2010s working with numbers integrated to the performance and opposition analysis within the clubs, which led to practical benefits on the football pitch. Teams could create real advantages against their rivals, and in order to maximize the benefits of the industry, departments and positions were created that no one had ever known before. From the 2010s people have paid much more attention to the numbers, and thanks to the evolution of technology, now there are millions of data, where from clubs have to select those ones that bring real advantages: whether on the football pitch or in the transfer window.
Source:
https://www.fifa.com/tournaments/mens/arabcup/arabcup2021/media-releases/the-future-is-now-fifa-bringing-performance-analytics-to-a-whole-new-levelMichael Cox: The Mixer (2020.)
Simon Kuper, Stefan Szymanski: Soccernomics (2014.)
